But why? Also, is there anything else he missed?
In The Big Sort, Bill Bishop has some interesting observations.
"...large partisan majorities had the effect of dampening turnout among citizens in the political minority. Rather than buck the majority and risk social sanction, citizens in the minority simply stayed away from the polls.
In communities with large political majorities, people tend to give up battling over ideas.... A vote becomes more an affirmation of the group than an expression of a civic opinion."Bishop notices the trend of people moving into like-minded communities, or what he calls sorting. If what he writes is true, groupthink and demographic shifts by community are major causes of the decline in civic engagement that Putnam has studied. So is sorting a cause of the decline in voting and other forms of social capital?
Kahneman and Tversky showed that loss aversion is the primary motivating factor for human behavior. Maybe that is what drives people to vote, write to their political representative, attend town hall meetings, or any of the other things Putnam used to measure civic engagement: they feared losing their way of life.
Maybe they stay home now because, due to sorting, their ingroup dominates their community and is getting their way. They don't feel the need to make their voice heard. Or, as in the quote above, they are a political minority not wanting to risk social isolation.
Of course, Putnam also said that more people are identifying as moderates and the extremists are the ones participating in their communities. If that's true, then extremism and social capital would be correlated. Are they?
I'm the map I'm the map I'm the map
Putnam insists that social capital improves tolerance. (Maybe he was just looking at tolerance for minorities and LGBT+?) However, if you look at the social capital index map of the U.S. and compare it to The Atlantic's map of political prejudice, it doesn't say what you would expect it to.
Massachusetts and Connecticut, which are in the top 60-80% for social capital, are among the least politically tolerant places in the country. New York, which is in the bottom 20% for social capital, is probably the most politically tolerant state.
Florida is disappointing in both regards, which is the most Florida thing ever. And North Dakota seems to score well in both measures.
Amanda Ripley's story declares Jefferson County New York the most politically tolerant county in the U.S. (although the interactive map places it in the 3rd percentile, where lower is better). Meanwhile, the social capital index places Jefferson County in the 34th percentile (where higher is better), scoring particularly poorly in Institutional Health (voting, confidence/trust) and not much better in Community Health (volunteering, church attendance, public meetings, etc.).
(The Atlantic's methodology could be the answer for the disparity. They excluded independents from their data. So a county with a high number of independent voters would only look at Rs and Ds, which might not be an accurate reflection.
Also, they relied on a survey. The social capital index looks at a lot of data, including measures of behavior, which I trust more. I'm more likely to believe a church's records of attendance than asking people to tell me how often they go to church.)
Still, I can't get over how different the results are. Maybe social capital isn't a strong predictor of political tolerance. Maybe it's political equilibrium.
(edit: super interesting study here finds that "when answering questions about the other party, individuals think about elites more than voters, and express more animus when the questions focus on elites. This suggests that increased affective polarization reflects, to some extent, growing animus towards politicians more than ordinary voters..."
"Fully 80% of our sample is “somewhat comfortable” or “extremely comfortable” with being friends or neighbors with those from the other party. While comfort with inter-party marriage is lower, even here, there is less anger than one would expect, with only 5% of the sample being “extremely upset” by this. This underlines that while people might feel negatively about the other party in the abstract, they are still comfortable interacting with them in ordinary situations."
So the politically tolerant counties might just overwhelmingly be politically disengaged people who don't follow national news. And politically intolerant counties answered the survey with U.S. Senators in mind, not their neighbors.)
Competition Breeds Collegiality?
Let's take a look at two maps. This first one is from The Big Sort showing how counties voted in the 2004 presidential election. White counties are "competitive," meaning the winner captured fewer than 20% of the vote.

Here is FiveThirtyEight's map from the 2016 election. Likewise, white counties are where the winner won by fewer than 20%.

Now here is the political tolerance map:

And here is the Social Capital Index map, where cream and light green counties are the highest (best):
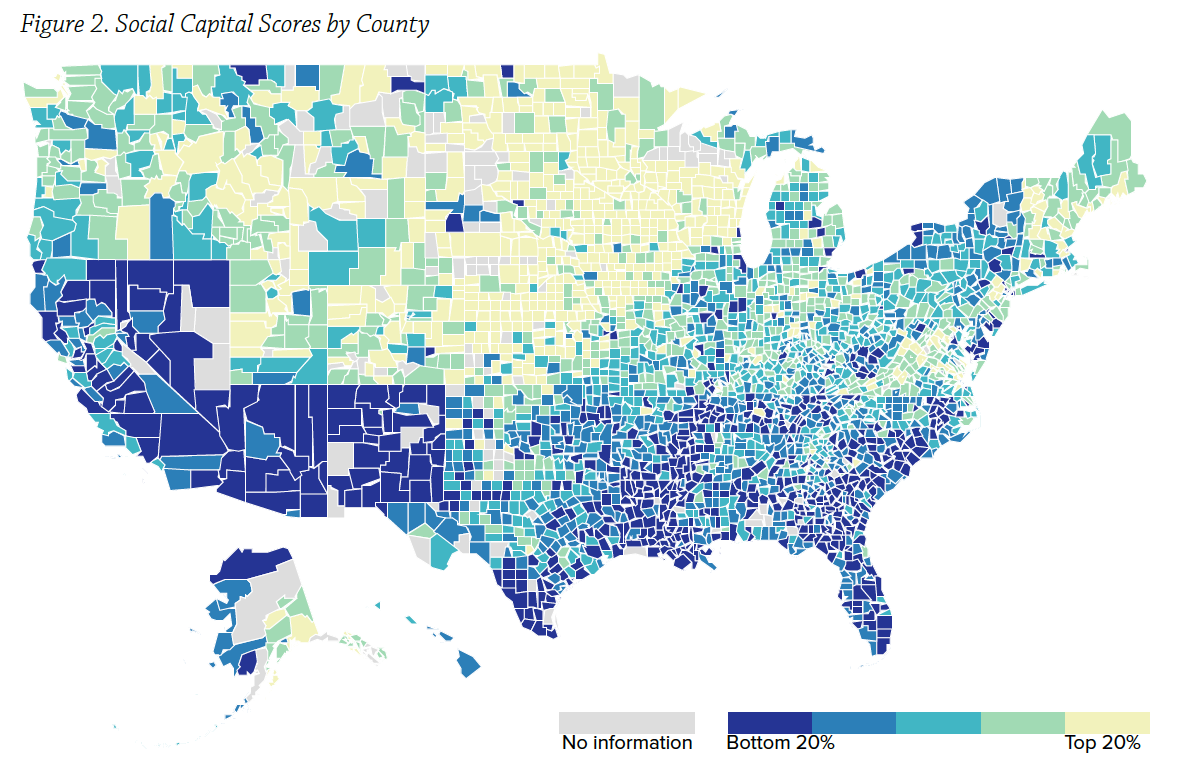
New England and some of the Great Lake states, and maybe Colorado seem to match well with the 538 map of competitive counties, but not much else. Maybe the moderates and politically disengaged are sorting into similar counties and not voting or participating civically, since they are not activists.
So there is some correlation between the three, but not much. Of course, this is just me eyeballing the map. Ideally I'd run a linear regression model. But, ya know, math.
Hierarchy of Needs
In the 1970s Political Scientist Ronald F. Inglehart seemed to predict the decline in social capital, well before Bowling Alone was published in 2000. Putnam was convinced that change in generational values was the largest factor for the decline in social capital, but Inglehart goes into the reasons why.
Sebastian Junger once said, "No food, one problem. Lots of food, many problems."
The Great Depression and WWII made hunger and security a problem. So the Silent Generation generally got along once we got out of that mess. As we became more prosperous in the 60s, people began caring about self actualization (ie "many problems").
So why didn't 911 and the Great Recession mirror the tragedies of the 30s and 40s and lead to bipartisanship? It's hard to tell the years below, but it seems like there was some stability after 9/11, but unfavorable views among the parties increased as we went into the recession.

The recession did seem to make things worse, according to this article.
" But a new study in the October issue of the American Sociological Review found that public support for government efforts to address social problems actually declined in the wake of the 2008 economic crisis.
"We found it surprising that as the Great Recession emerged, the American public moved quickly toward lower levels of support for government policy solutions to social problems," said Clem Brooks...
"The key is partisanship," Brooks said. "We found that it wasn’t the public as a whole that moved away from support for government policy solutions. Self-identified Democrats actually became slightly more supportive of government solutions between 2008 and 2010. But self-identified Independents and especially Republicans experienced a large shift in the opposite direction."This would agree with the unfavorable ratings among Rs being worse, according to the Pew chart above. It should surprise no one that Democrats supported the government when they controlled all three branches and Republicans opposed it.
Did I made a huge mistake?
As a localist, the question I'm struggling with is: Is that what I want; people voluntarily moving into ideological bubbles even if it makes them more extreme?
I believe that people should be able to live in a community of like-minded citizens. And I believe it should be easy for people to leave a community where they don't fit in to one where they do. (And I believe that top down, one size fits all solutions make this type of living impossible.)
I worry that this direction will lead to extremism at the local level. But there may be a split where people seek communities that prioritize civil behavior over extremism.
Finally,
Both Bishop and Putnam seem to suggest that extremists are more active politically, and moderates less so. Putnam says the share of self-identified moderates is increasing. I just don't know where this is showing up in the data.
I guess it could be that increasing landslide victories isn't just indicative of sorting, but of moderates staying home and not voting. And those moderates might be politically tolerant people, so the extremists who do vote overwhelmingly for a candidate aren't representative of the entire county.
I still want to know what causes politically tolerant counties? Have they been unaffected by sorting? Are they filled with moderates? Do they have lots of interaction with their outgroup?
This data makes me less hopeful that social capital can decrease polarization, especially if sorting, loss aversion, and a common enemy are what drive social capital.
I think the story is that social capital was highest in the 1950s and political polarization and tolerance was doing well too. Social capital didn't just decline in the 1960s, it became concentrated among extremists who started living near one another, creating a feedback loop of moderate disengagement.
I believe that social capital works best when moderates have a seat at the table. How to encourage that is the question I'm trying to answer.
No comments:
Post a Comment